Documentation
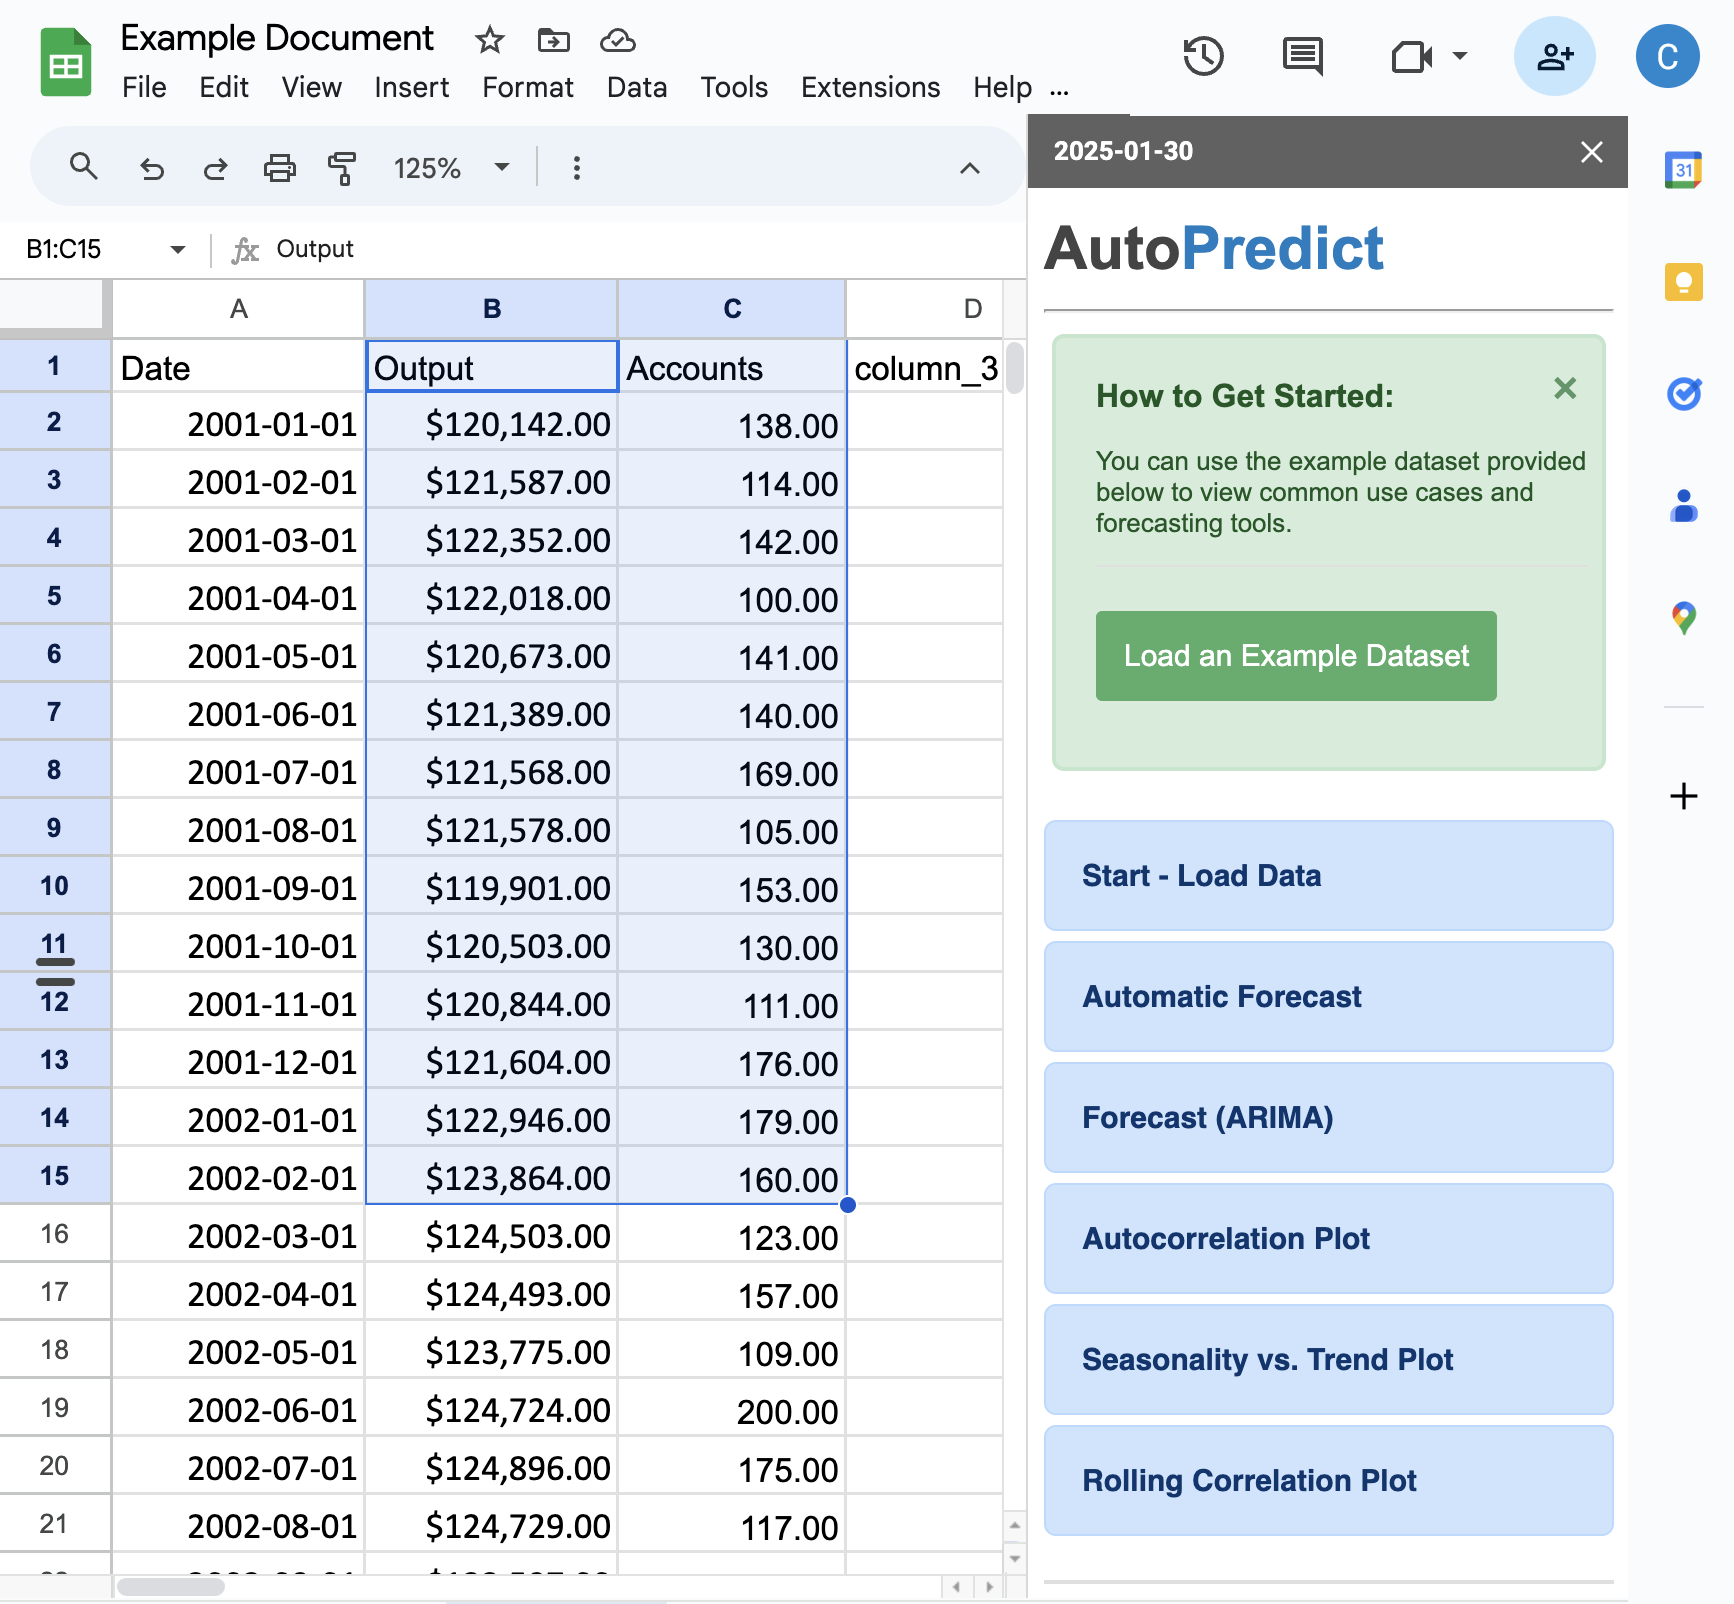
AutoPredict runs inside a sidebar panel in Google Sheets and offers six main functions.
Use this page to read the documentation and instructions for each function. More technical details about the code and algorithms used in each function can be found here:
Start - Load Data
Automatic Forecast
Forecast (ARIMA)
Autocorrelation Plot (ACF)
Seasonality vs. Trend Plot
Rolling Correlation Plot
Start - Load Data
Description
Data must be loaded to the sidebar before any other functions can be performed.
If you don't have any data yet, you can use the example dataset provided with the app.
Instructions
- Highlight a range of cells in the spreadsheet
- Click "Load Data"
Details
- It is not necessary to provide calendar dates or time. Every data observation is assumed to be evenly spaced and chronologically ordered.
Output
The sidebar will be populated with the name of each selected column. As shown in the example, there are three columns:
- "Date", a date variable with 14 observations
- "Output", a numeric variable with 14 observations
- "Accounts", a numeric variable with 14 observations


Automatic Forecast
Description
This function will automatically create a forecast and plot results in a new sheet. Make sure to load data to the sidebar panel before running this step.
Instructions
- Select the data you want to forecast in the dropdown menu.
- Select the data frequency, if it is known. See details below.
- Click "Run Forecast".
Details
- Select a Frequency: If you leave this field blank, then the app will automatically detect the frequency for you. However, you should always check that the returned value makes sense to you, as the algorithm has no knowledge of the real-world surrounding your data. See more details here:
- Add a Predictor: (Optional) Linear predictors can be added into the model to create an ARIMAX forecast. See how to do so here.
- Details of the algorithm used to build the forecasts can be found here.
Output
- A new sheet will be created in the document that contains the forecast plot and model information.

Forecast (ARIMA)
Description
Creates an ARIMA model forecast and results in a new sheet. Make sure to load data to the sidebar panel before running this step. See how to do so here.
Instructions
- Select the data you want to forecast in the dropdown menu.
- Select the ARIMA model parameters.
- Select the data frequency.
- Click "Run Forecast".
Details
- Forecast Horizon: The default length of the forecast is 40 observations and can be changed manually.
- Add a Predictor: (Optional) Linear predictors can be added into the model to create an ARIMAX forecast. See how to do so here.
Output
- A new sheet will be created in the document that contains the forecast plot and model information.

Autocorrelation Plot (ACF)
Description
Creates an ACF and PACF plot of the data.
Instructions
- Select the data you want to analyze in the dropdown menu.
- Click "Run Analysis".
Details
- The ACF and PACF plots can be used to study the periodic structure of the data and determine the specifications for an ARIMA model. You can read more about how this works here:
- Maximum lag of the plot is 36 observations.
Output
- A new sheet will be created in the document that contains the ACF and PACF plots. An example is shown below.


Seasonality vs. Trend Plot
Description
Creates an ARIMA model forecast and results in a new sheet. Make sure to load data to the sidebar panel before running this step. See how to do so here.
Instructions
- Select the data you want to forecast in the dropdown menu.
- Select the ARIMA model parameters.
- Select the data frequency.
- Click "Run Forecast".
Details
- Add a Predictor: (Optional) Linear predictors can be added into the model to create an ARIMAX forecast. See how to do so here.
- Details of the algorithm used to build the forecasts can be found here.
Output
- A new sheet will be created in the document that contains the forecast plot and model information.

Rolling Correlation Plot
Description
Creates an ARIMA model forecast and results in a new sheet. Make sure to load data to the sidebar panel before running this step. See how to do so here.
Instructions
- Select the data you want to forecast in the dropdown menu.
- Select the ARIMA model parameters.
- Select the data frequency.
- Click "Run Forecast".
Details
- Add a Predictor: (Optional) Linear predictors can be added into the model to create an ARIMAX forecast. See how to do so here.
- Details of the algorithm used to build the forecasts can be found here.
Output
- A new sheet will be created in the document that contains the forecast plot and model information.